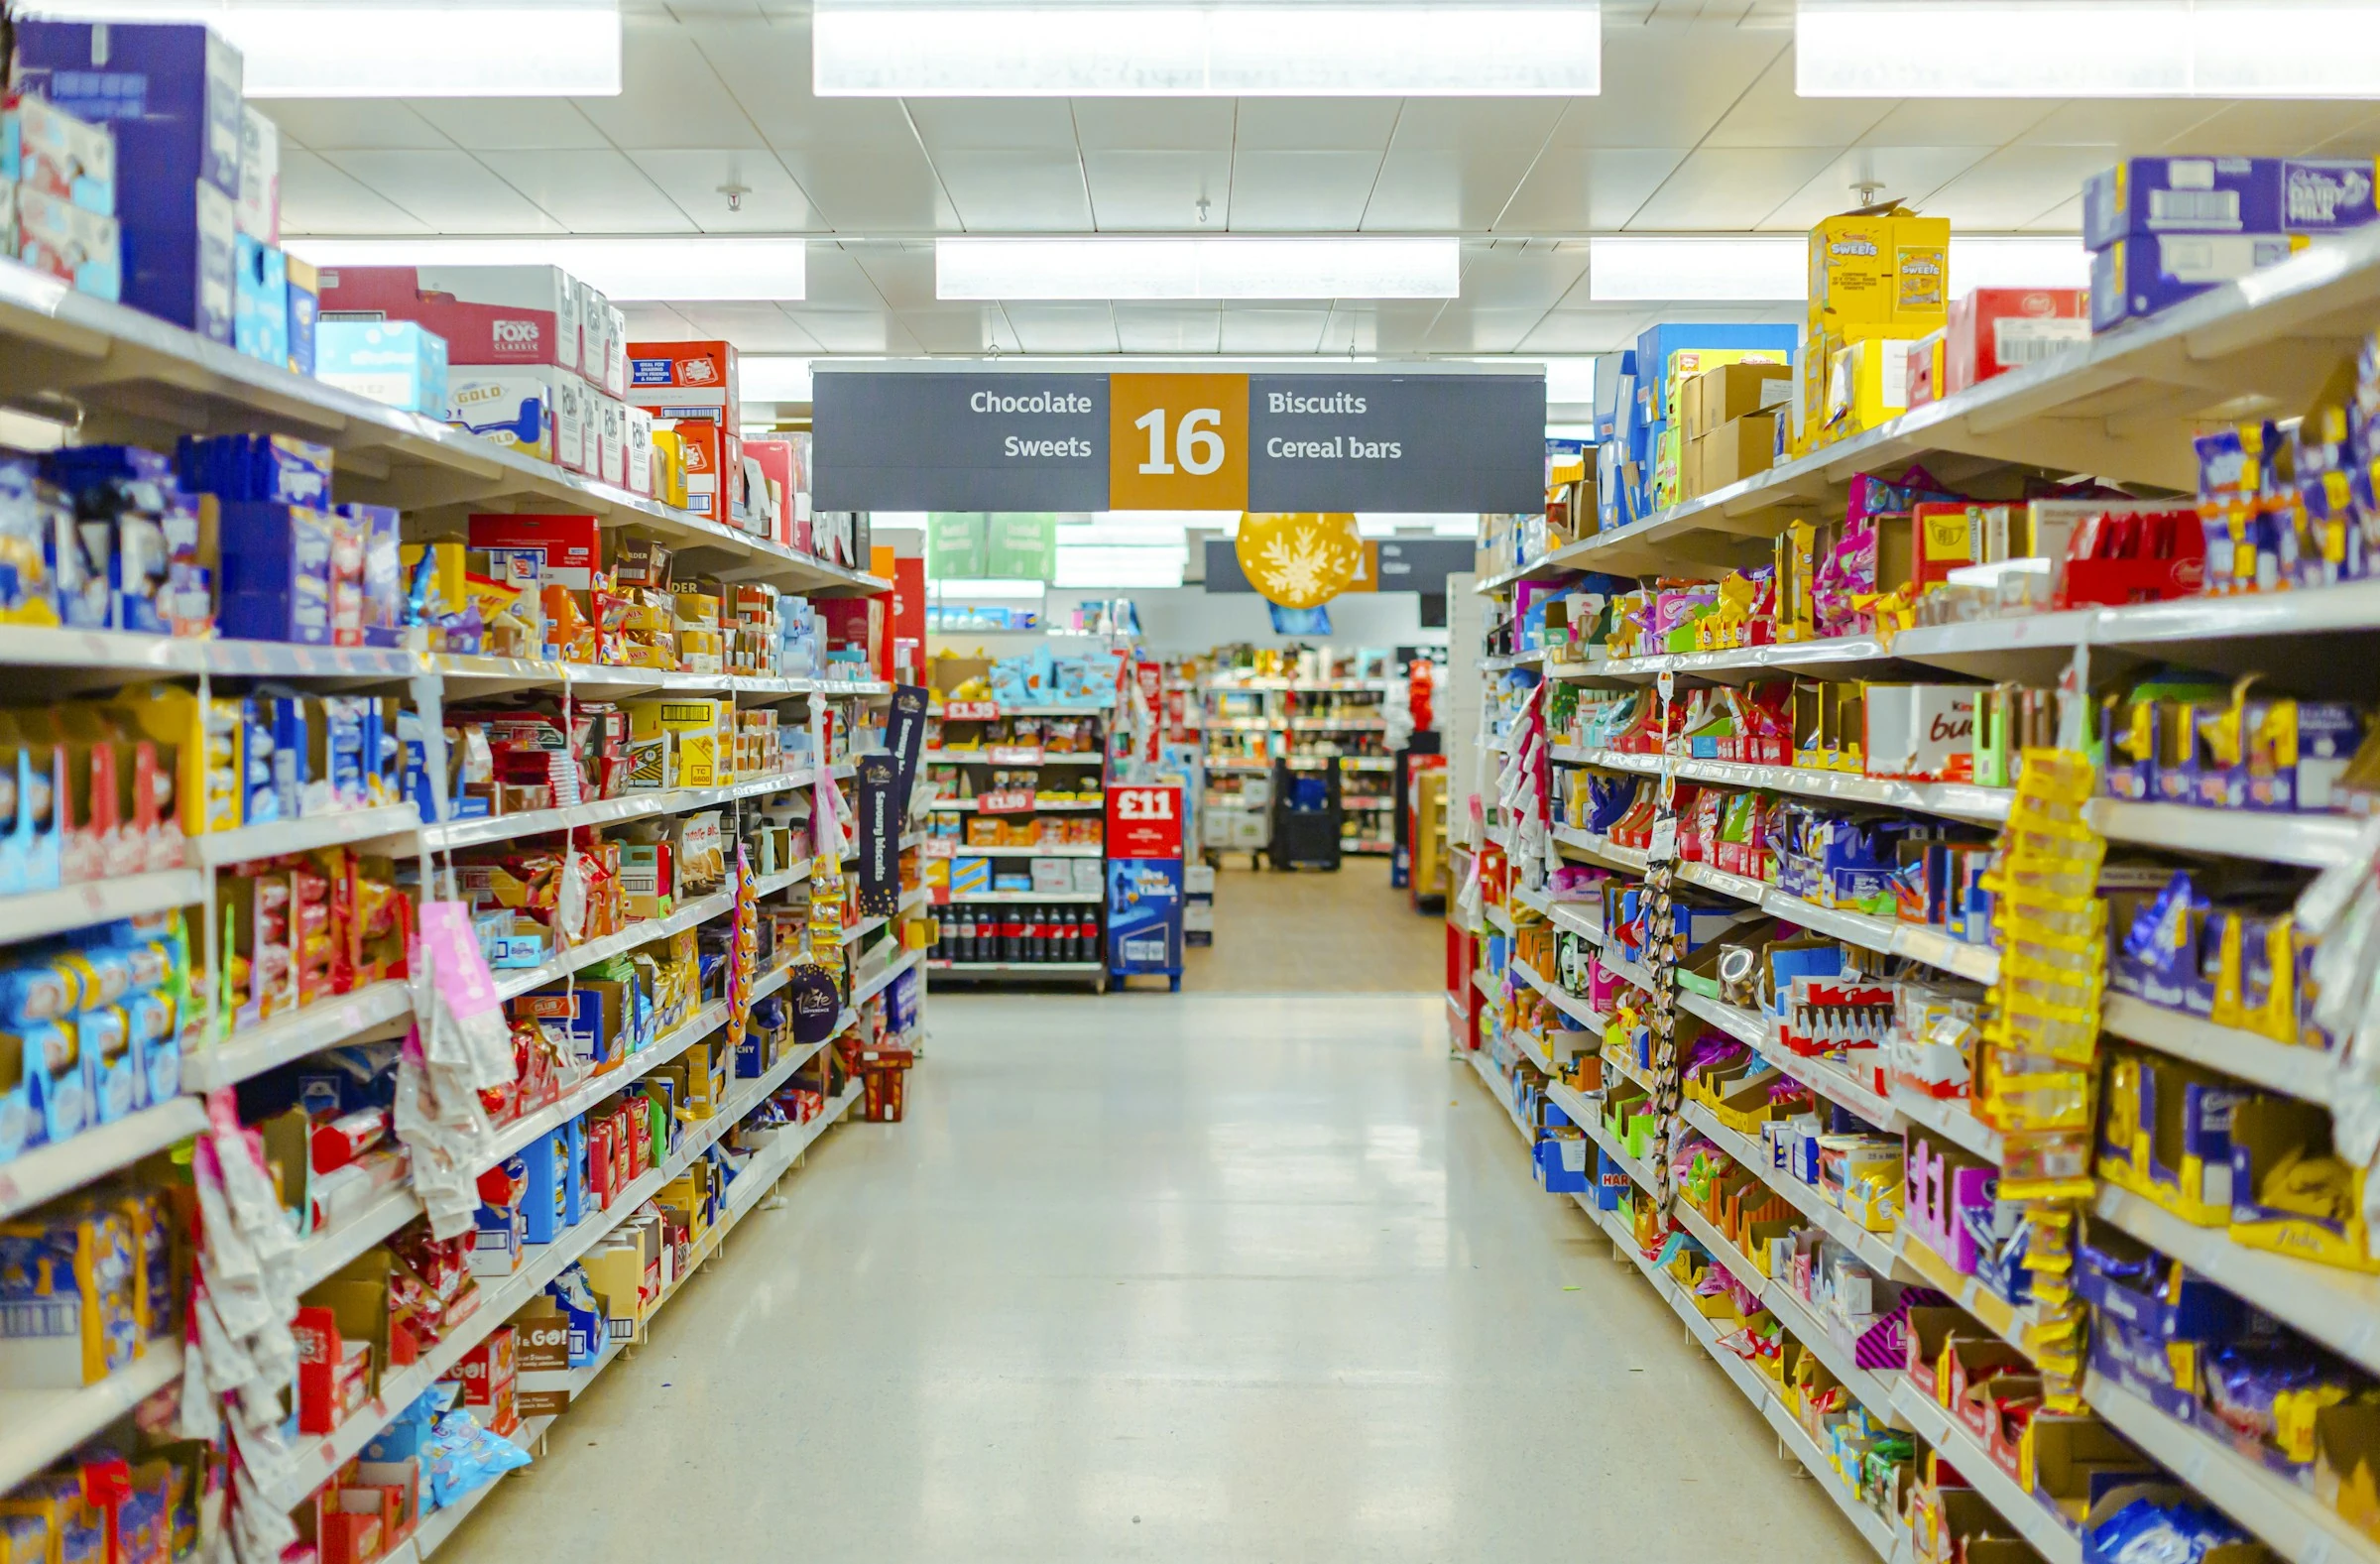

Your usual cereal still costs $4.99, so nothing has changed—right? Look again. The box may now contain less cereal, quietly raising the price of every ounce.
This is far from an imaginary problem. In a 2023 study, the U.S. Bureau of Labor Statistics found that 2.9% of observed food prices experienced package downsizing or upsizing between 2015 and 2021. Snacks recorded 509 size changes during that period (BLS).
British consumers are noticing the same pattern. A Which? survey of 1,568 adults found that 77% had seen shrinkflation, while 75% considered the practice insufficiently transparent (Which?).
Fortunately, grocery price apps can help you uncover the real increase before a smaller package quietly becomes your new normal.
What shrinkflation really means
Shrinkflation happens when a manufacturer reduces the quantity of a product without making a proportional reduction in its price. The shelf price might stay unchanged—or even fall slightly—while the price per gram, ounce, millilitre, sheet or item rises.
Manufacturers can make the reduction difficult to notice by:
- Keeping the package roughly the same height or width
- Adding more empty space inside a bag
- Deepening the hollow base of a jar or bottle
- Redesigning the label at the same time
- Reducing the number of items rather than the package dimensions
- Replacing a familiar size with a “new” product and barcode
The BLS notes that companies may change package colours, materials or designs alongside a size reduction, making direct visual comparisons harder. It therefore calculates an effective price per standard unit when measuring inflation (BLS).
That is exactly the method you can apply with a grocery comparison app.
The calculation that exposes a smaller package
The shelf price alone tells you very little. You need two figures:
- The product’s price
- Its weight, volume or item count
Divide the price by the quantity:
unit price = package price ÷ package quantity
Consider a simple example:
- Old package: $4 for 500 grams = $0.008 per gram
- New package: $4 for 450 grams = $0.00889 per gram
Although the shelf price is unchanged, the unit price has increased by approximately 11.1%.
This is not merely a mathematical technicality. Which? found that one mouthwash product decreased from 600ml to 500ml while becoming more expensive at Tesco. The result was a 46% increase in its price per 100ml (Which?).
Which? Retail Editor Ele Clark summarised the problem clearly:
“Our research shows that while some popular products are subtly decreasing either in size or quality, the same can’t be said for their prices – which means shoppers are inadvertently paying more for less.”
A useful grocery price app should therefore let you record quantities, compare unit prices or retrieve earlier product information. No single app does every job perfectly, so the best option depends partly on where you live.
How I assessed the five apps
I checked each app against the same practical shrinkflation workflow:
- Can you identify the exact product rather than a general category?
- Does the listing show its weight, volume or count?
- Can you compare prices across package sizes?
- Is there a barcode scanner?
- Can you view or preserve older information?
- Does the app cover everyday groceries in its target market?
The apps below are not all dedicated shrinkflation detectors. Instead, each provides one or more tools needed to build reliable evidence: package data, unit-price calculations, price histories, digital flyers or saved comparisons.
1. Trolley.co.uk: best for UK price histories
Availability: United Kingdom; iOS, Android and web
Trolley.co.uk is the most complete option in this list for British households. Its official feature list includes price histories, price alerts, barcode scanning and comparisons across more than 16 UK retailers. The service says its database contains over 200,000 products (Trolley.co.uk).
In my test workflow, the price-history view was the feature that mattered most. After finding the exact product, I could examine its current package description and earlier pricing. If a familiar 500g product becomes a 450g listing, the history gives you a starting point for checking when the change appeared.
The barcode scanner is helpful when similar products have nearly identical names. However, you still need to verify the quantity shown in the app against the physical package because reformulated or resized products sometimes receive new listings.
Pros
- Price-history charts make longer-term changes easier to investigate
- Barcode scanning helps identify the correct product
- Covers major UK supermarkets, including Tesco, Asda, Sainsbury’s, Morrisons, Aldi, Waitrose and Ocado
- Price alerts can flag changes in frequently purchased items
- Free to use
Cons
- Limited to the UK grocery market
- Not every retailer or product is included
- A price graph alone does not prove shrinkflation; you must also compare package quantities
- Old and new package versions may appear as separate products
Best shrinkflation use: Save regularly purchased branded goods and check both the package description and price history whenever the packaging changes.
2. Flipp: best for comparing old and new flyers
Availability: Primarily the United States and Canada; iOS and Android
Flipp gathers digital weekly advertisements, offers and coupons from local retailers. Its U.S. App Store listing says it covers more than 2,000 stores and lets you search flyers, clip offers and organise products in a shopping list (Flipp on the App Store).
Flipp worked best as a visual comparison tool. Grocery flyers frequently include a product image, package size and advertised price. When a current promotion looks less generous than you remember, comparing the advertised quantity with an older screenshot or saved offer can reveal the change.
Its search function is also useful for comparing the same product across nearby stores. Just be careful with promotions: a lower sale price does not necessarily compensate for a smaller package.
Pros
- Brings local grocery flyers into one searchable place
- Product images can make packaging changes easier to notice
- Shopping lists preserve the exact quantity you intended to buy
- Useful for comparing advertised sizes across retailers
- Free and straightforward to use
Cons
- Not a dedicated unit-price calculator
- Flyer coverage depends on participating local retailers
- Listings may disappear after a promotion ends
- Advertisements sometimes show limited product details
- You may need screenshots to create a dependable personal history
Best shrinkflation use: Save or capture recurring flyer offers and compare the printed weight, volume or count—not just the promotional price.
3. ShopSavvy: best for barcode-based price tracking
Availability: iOS and Android; retailer coverage varies by country and product
ShopSavvy lets you scan a barcode and compare its price across online and physical retailers. It also offers multi-retailer price histories and tracks which seller had the lowest price at a given time (ShopSavvy).
The barcode workflow is quick, particularly for packaged household goods such as coffee, cereal, cleaning products and paper goods. Scanning the old package and then the replacement can help you determine whether the two versions have different barcodes.
The price-history chart is valuable, but it tracks the identified product rather than automatically connecting every old and new package version. If downsizing creates a new barcode, you may have to search for both products separately and compare their quantities manually.
Pros
- Fast barcode identification
- Multi-retailer price-history charts
- Watchlists and price tracking
- Useful for groceries and non-food household essentials
- Available on both major mobile platforms
Cons
- Grocery coverage can be less complete than coverage for general retail products
- Local supermarket prices may not always appear
- Different barcodes can split an old and resized product into separate histories
- Unit-price comparisons still require attention to package size
- Marketplace or third-party listings can complicate comparisons
Best shrinkflation use: Scan packages before discarding them, then compare their barcodes, quantities and price histories with the replacement version.
4. Open Food Facts: best for package evidence
Availability: International; iOS and Android
Open Food Facts is a nonprofit, collaborative product database. Its Android listing says the app can scan more than four million food products and lets users add product photographs and information when an item is missing (Open Food Facts on Google Play).
This app takes a different approach from conventional grocery comparison tools. Its strength is product documentation rather than retailer-wide price comparison. Scanned records can contain the quantity, packaging, ingredients and other label information. The app also supports Open Prices, which allows shoppers to submit shelf prices or receipts specifically to improve price transparency and help track shrinkflation.
In practice, the combination of package photos, quantities and contributed prices makes it useful for documenting a suspected change. Its scan-history export provides another way to preserve the items you checked.
Because the database is community-maintained, records can be incomplete or outdated. Open Food Facts itself warns that information may not be fully accurate and should be checked against the physical packaging.
Pros
- International, open product database
- Barcode scanner and product-photo records
- Supports quantity, packaging and ingredient information
- Users can contribute shelf prices and receipts
- Exportable scan history
- Particularly useful for detecting related “skimpflation” recipe changes
Cons
- Community data quality varies
- Some products have missing quantities or old photographs
- Price coverage is less consistent than product coverage
- Requires more manual checking than a mainstream shopping app
- Duplicate records can make comparisons confusing
Best shrinkflation use: Scan the package, check its recorded quantity and photographs, and preserve the entry so you can compare it with a later version.
5. UnitSmart: best for quick unit-price calculations
Availability: Apple devices; regional App Store availability may vary
UnitSmart is a simple unit-price calculator designed for supermarket comparisons. You enter the product name, price, quantity and unit; the app calculates the cost per gram, millilitre or item. It also saves comparisons and works offline (UnitSmart on the App Store).
This was the least complicated app in the group. It does not depend on retailer databases, product feeds or reliable internet access. That makes it useful when shelf labels use inconsistent units or when a supermarket app omits unit pricing.
For shrinkflation tracking, I found the saved-comparison format more valuable than the initial calculation. Recording the date in the product name—such as “coffee, July 2026”—creates a basic personal price history. When the package changes, add a second entry and compare the results.
Pros
- Clear price-per-unit calculations
- Supports weight, volume and item counts
- Saved comparisons help document changes
- Works offline
- No account or subscription required
- Developer states that the app does not collect data
Cons
- Manual data entry is required
- No retailer database or automatic price updates
- No barcode scanner
- Currently limited to Apple platforms
- A typing error can distort the comparison
Best shrinkflation use: Keep saved unit-price records for the 10–20 packaged products you buy most frequently.
A reliable app-based checking routine
You do not need to investigate every product in your trolley. Focus on frequently purchased packaged goods, particularly snacks, coffee, cereal, cleaning products, toiletries and paper goods. BLS research found that household paper products recorded more package-size changes than any other category in its 2015–2021 sample (BLS).
Use this routine when something looks different:
- Identify the exact product. Scan its barcode where possible.
- Record the current price and quantity. Include weight, volume, number of portions, sheets or individual items.
- Find the old quantity. Check an app’s product history, an earlier flyer, a saved comparison, a receipt or an older package.
- Convert both products to the same unit. Do not compare price per kilogram with price per 100 grams without converting one of them.
- Calculate the percentage change. Compare the old and new unit prices.
- Check for a new barcode. A replacement barcode may explain why the app’s price history appears to start suddenly.
- Verify the label. App records can be delayed, incomplete or incorrectly matched.
- Look beyond size. Compare ingredient percentages, serving counts and concentration because skimpflation can reduce quality without changing package weight.
Grocery price apps are becoming more useful
The most important development is the shift from simple coupon lists toward richer product evidence. Price histories, barcode scanners, receipt uploads and crowdsourced package photographs can now be combined to reconstruct changes that a shelf label does not show.
Official statistics are moving in a similar direction. The UK Office for National Statistics has developed grocery scanner-data methods that specifically account for products being relaunched with different weights or product codes (ONS). The agency explains that failing to connect an original item with its resized replacement can prevent a price index from capturing the effective increase.
That same limitation affects consumer apps. Automated histories are useful, but they are strongest when combined with your own saved quantities, package photographs and receipts.
The bottom line
Shrinkflation hides in the relationship between quantity and price. A familiar shelf price, redesigned package or attractive promotion can distract you from a higher cost per unit.
Trolley.co.uk offers the strongest grocery-specific history for UK shoppers, while Flipp is practical for monitoring North American flyers. ShopSavvy helps track barcoded products across retailers, Open Food Facts preserves collaborative package evidence, and UnitSmart provides the cleanest manual calculation.
None is a perfect automatic shrinkflation detector. Together, however, their price histories, barcode records, product photographs and unit-price calculations make smaller packages considerably harder to hide.
References
- U.S. Bureau of Labor Statistics — Getting Less for the Same Price?
- Which? — Shrinkflation or Skimpflation?
- Office for National Statistics — Introducing Grocery Scanner Data Into Consumer Price Statistics
- Trolley.co.uk — Grocery Price Comparison App
- Flipp — Official App Store Listing
- ShopSavvy — Price Comparison App
- Open Food Facts — Official Google Play Listing
- UnitSmart — Official App Store Listing